Initiated on the behest of the Hon’ble Prime Minister, The National Institutional Ranking Framework (NIRF) is out with its first round of rankings across Engineering, Management, Pharmacy & Universities across the length and breadth of the country. While the exhaustive ranking framework which outlined the methodology to rank institutions across the country was received quite well, its eventual execution encompassing the entire deck of institutions falling in various categories couldn’t evoke the desired interest amongst the members of the general public and observers alike. However, considering the NIRF outcomes from a different perspective this entire exercise has laid the very foundations of DATA DRIVEN eduGOVERNANCE. digitalLEARNING chose to delve deep into the outcomes of this major national exercise and comment upon the various underlying facets of the same for the consumption of our readers which include the formulators and regulators of NIRF. Hope this analytical commentary would be an interesting & illuminating reading.
Key Departures
| ONE While the original ranking framework called for a differentiation between Category A Institutions which have Research & Teaching as twin foci and Category B Institutions which are simply Teaching ones. The eventual rankings seem to have juxtaposed both the Category A and Category B institutions. This seems to be a major departure from the doctrine of not comparing apples with oranges. |
TWO Unavailability of the Computation of Individualized Scores based on the Datasets provided by the participating institutions make it difficult to ascertain the parameterized ranking of institutions beyond top 10 which have been specifically given their rankings on chosen parameters. Incidentally, it’s the institutions lower in the ranking deck who need to know more about their respective category ranking to improvise upon. |
For example, the reported dataset of IIT Madras with Institute ID NIRF-ENGG-INF-77 (Engineering) the following is the name and denomination of the dataset submitted. |
|
|
|
 |
|
 Teaching, Learning and Resources parameter by NIRF |
|
 |
The NIRF layout defi nes the parameter of Teaching, Learning and Resources (TLR) as a mix of 4 components as in a) Faculty-Student Ratio with Emphasis on Permanent Faculty (FSR) b) Combine Metric for Faculty with PhD and Experience (FQE) c) Metric for Library and Laboratory Facilities (LL) d) Metric for Sports and Extra-Curricular Facilities, Activities (SEC) |
 |
The parameter on Research, Professional Practice & Collaborative Performance (RPC) entails a) Combined Metric for Publications (PU) b) Combined Metric for Citations (CI) c) IPR and Patents: Granted, Filed, Licensed (IPR) d) Percentage of Collaborative Publications and Patents (CP) e) Footprints of Projects and Professional Practice (FPPP) |
 |
Graduation Outcome (GO) a) Combined Performance in Public and University Examinations (PUE) b) Combined Percentage for Placement, Higher Studies and Entrepreneurship (PHE) c) Mean Salary for Employment (MS) |
 |
Outreach and Inclusivity (OI) a) Outreach Footprint (Continuing Education, Service) (CES) b) Percentage of Students from Other States/Countries(Region Diversity – RD) c) Percentage of Women Students and Faculty (WS) d) Percentage of Economically and Socially e) Disadvantaged Students (ESDS) |
 |
Perception (PR) Process for Peer Rating in Category (PR)Scrutinizing by these two parameters itself, things don’t seem to be falling in a rigorous order. Interestingly, the parameter on perception at number (f) is somehow interspersed between those of Publication Details and IPR Summary. This is a signifi cant departure from the established practice of rigorous data processing whereby the consistency of the framework has to be ensured by all means. Incidentally, Datasets for some of the parameters are missing altogether. |
Data Analysis & Presentation Framework
The mammoth exercise of India Rankings 2016 based on NIRF somehow lost the opportunity to sync up the various institutional databases in a single repository. The underlying technological engine has chosen to use Excel Workbook as the pre-eminent reporting as well as processing tool. Interestingly, a significant space is devoted in the NIRF report over Online Data Capturing Platform and Data Submission Utility. On a cursory glance, it seems to be an utterly manual process, whereby right from data submission to data processing to data presentation, has been done in a loosely coupled technology ecosystem.
An emphasis on adopting an ERP framework to ensure a steady real time flow of the multifaceted datasets from institutions could have helped the cause in a much significant manner. May be in the next iteration of the rankings, the Implementation Core Committee from NBA which has also been bestowed upon the task of accrediting technical institutions would call for the creation of an integrated data foundation across educational institutions powered by an industry grade ERP solution.

HIGH CORRELATION OF ENGINEERING RANKING WITH ANALYTICAL WEB METRICS
Interestingly, the NIRF Rankings have a high degree of correlation with analytical web metrics like Moz. We subjected the URLs of each of the top 100 Engineering Institutions to the Domain Authority Score ( a 100-point scale) developed by Moz that predicts how well a website will rank on search engines.
To determine Domain Authority, Moz employs machine learning against Google’s algorithm to best model how search engine results are generated. Over 40 signals are included in this calculation.
Interestingly the Correlation Coefficient on NIRF Rank and Moz Rank data came out to be a impressive 0.74 which implies that both datasets match-up 75% of the times.
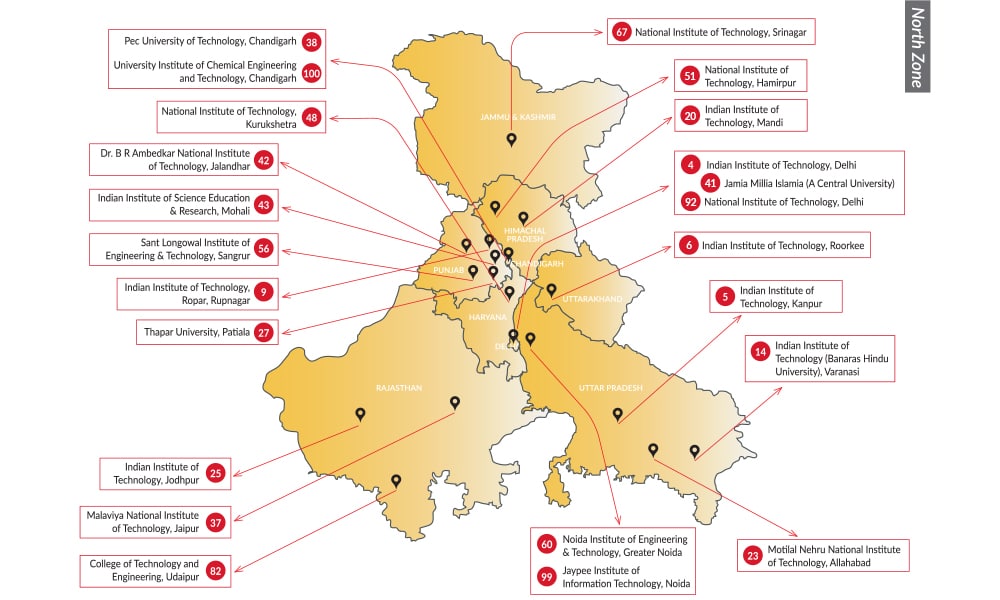
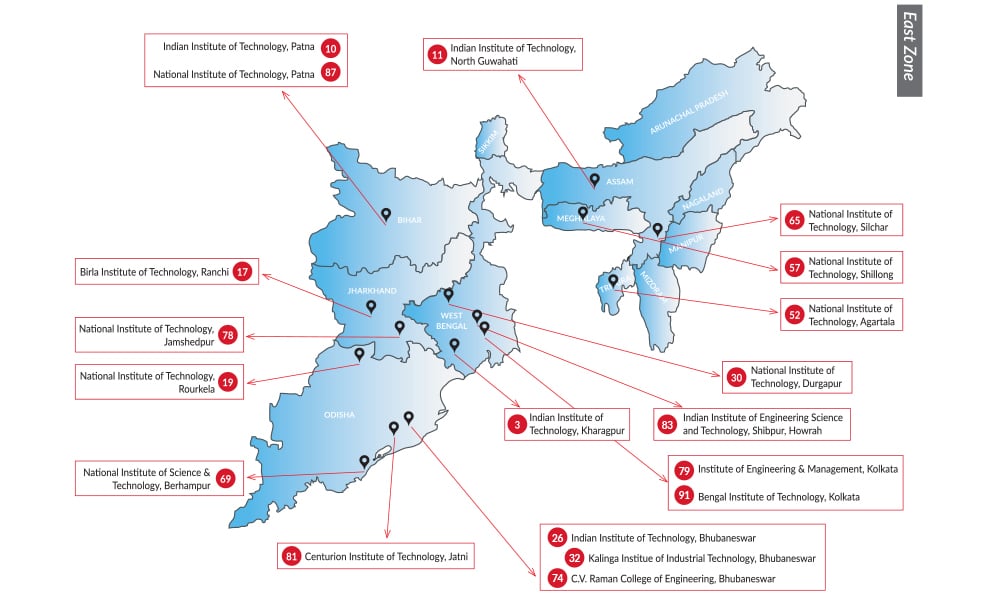
| Name of Institute | NIRF Score | NIRF Rank | MOZ Score | MOZ Rank |
| Indian Institute Of Technology, Madras | 89.41 | 1 | 72.05 | 2 |
| Indian Institute Of Technology, Bombay | 87.66 | 2 | 72.55 | 1 |
| Indian Institute Of Technology, Kharagpur | 83.91 | 3 | 69.13 | 5 |
| Indian Institute Of Technology, Delhi | 82.02 | 4 | 70.79 | 3 |
| Indian Institute Of Technology, Kanpur | 81.07 | 5 | 69.49 | 4 |
| Indian Institute Of Technology, Roorkee | 78.68 | 6 | 58.56 | 9 |
| Indian Institute Of Technology, Hyderabad | 77.22 | 7 | 53.02 | 17 |
| Indian Institute Of Technology, Gandhinagar | 75.2 | 8 | 48.95 | 23 |
| Indian Institute Of Technology, Ropar-Rupnagar | 74.88 | 9 | 38.23 | 59 |
| Indian Institute Of Technology, Patna | 74.68 | 10 | 42.98 | 45 |
| Indian Institute Of Technology, North Guwahati | 74.62 | 11 | 54.48 | 15 |
| National Institute Of Technology, Tiruchirappalli | 74.45 | 12 | 53.05 | 16 |
| Vellore Institute Of Technology | 74.4 | 13 | 60.59 | 7 |
| Indian Institute Of Technology (Banaras Hindu University), Varanasi | 74.39 | 14 | 45.26 | 37 |
| Sardar Vallabhbhai National Institute Of Technology | 73.13 | 15 | 47.27 | 31 |
| Indian Institute Of Technology, Indore | 72 | 16 | 45.64 | 34 |
| Birla Institute Of Technology | 71.8 | 17 | 48.03 | 27 |
| Visvesvaraya National Institute Of Technology, Nagpur | 71.29 | 18 | 47.65 | 29 |
| National Institute Of Technology, Rourkela | 70.8 | 19 | 54.77 | 14 |
| Indian Institute Of Technology, Mandi | 70.32 | 20 | 43.73 | 43 |
| College Of Engineering, Pune | 69.71 | 21 | 50.38 | 21 |
| National Institute Of Technology Karnataka, Mangalore | 68.95 | 22 | 52.07 | 18 |
| Motilal Nehru National Institute Of Technology, Allahabad | 67.94 | 23 | 51.79 | 20 |
| Psg College Of Technology-Coimbatore | 67.8 | 24 | 48.37 | 26 |
| Indian Institute Of Technology, Jodhpur | 67.68 | 25 | 45.04 | 38 |
| Indian Institute Of Technology, Bhubaneswar | 67.58 | 26 | 44.18 | 42 |
| Thapar University-Patiala | 67.51 | 27 | 44.39 | 41 |
| National Institute Of Technology, Warangal | 67.12 | 28 | 48.63 | 24 |
| Thiagarajar College Of Engineering, Madurai | 66.51 | 29 | 47.32 | 30 |
| National Institute Of Technology, Durgapur | 65.4 | 30 | 47.08 | 32 |
| Amrita School Of Engineering | 63.94 | 31 | 55.07 | 11 |
| Kalinga Institue Of Industrial Technology | 63.4 | 32 | 45.51 | 36 |
| M. S. Ramaiah Institute Of Technology, Bangalore | 63.39 | 33 | 40.46 | 54 |
| Coimbatore Institute Of Technology-Coimbatore | 62.58 | 34 | 35.29 | 67 |
| National Institute Of Technology, Calicut | 62.26 | 35 | 55.04 | 13 |
| R.V. College Of Engineering, Bengaluru | 62.26 | 36 | 36.18 | 64 |
| Malaviya National Institute Of Technology, Jaipur | 62.14 | 37 | 47.96 | 28 |
| Pec University Of Technology-Chandigarh | 61.32 | 38 | 40.92 | 50 |
| Manipal Institute Of Technology | 61.15 | 39 | 58.79 | 8 |
| Shanmugha Arts Science Technology & Research Academy (Sastra) | 61.11 | 40 | 51.92 | 19 |
| Jamia Millia Islamia (A Central University) | 60.18 | 41 | 48.42 | 25 |
| Dr. B R Ambedkar National Institute Of Technology, Jalandhar | 59.91 | 42 | 45.62 | 35 |
| Indian Institute Of Science Education & Research, Mohali | 59.58 | 43 | 41.43 | 49 |
| Karunya Institute Of Technology And Sciences | 59.29 | 44 | 49.71 | 22 |
| Institute Of Technology, Nirma University | 59.23 | 45 | 40.71 | 53 |
| Kongu Engineering College | 59.06 | 46 | 31.19 | 81 |
| Sona College Of Technology, Salem | 58.97 | 47 | 34.80 | 68 |
| National Institute Of Technology, Kurukshetra | 58.89 | 48 | 44.78 | 40 |
| Pondicherry Engineering College | 58.79 | 49 | 39.32 | 55 |
| Amrita Viswa Vidyapeetham-Amrita Nagar (Po) , Ettimadai | 58.78 | 50 | 55.07 | 11 |
| National Institute Of Technology, Hamirpur | 58.65 | 51 | 46.88 | 33 |
| National Institute Of Technology, Agartala | 58.63 | 52 | 32.43 | 76 |
| Kumaraguru College Of Technology-Coimbatore | 58.44 | 53 | 33.54 | 70 |
| B.S. Abdur Rahman Institute Of Science And Technology | 57.8 | 54 | 31.32 | 80 |
| Cochin University Of Science And Technology-Cochin | 57.69 | 55 | 55.37 | 10 |
| Sant Longowal Institute Of Engineering & Technology, Sangrur | 57.52 | 56 | 38.10 | 61 |
| National Institute Of Technology, Meghalaya | 57.47 | 57 | 32.84 | 73 |
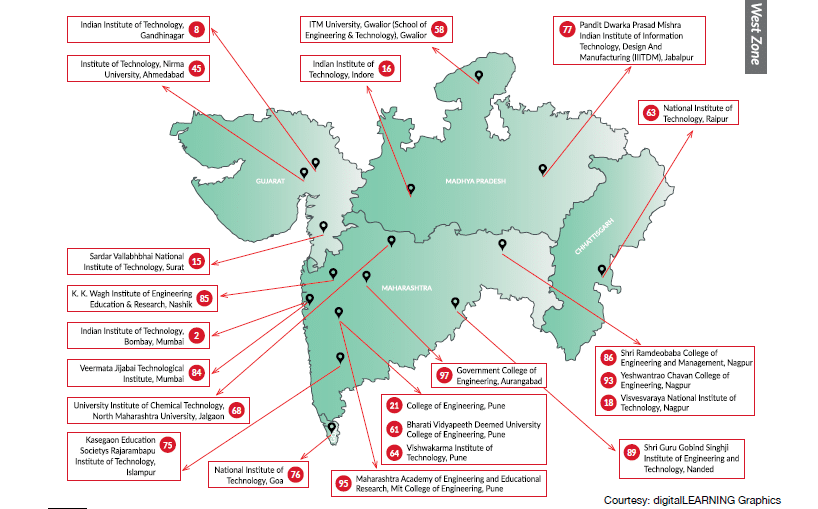
| ITM University, Gwalior (School Of Engineering & Technology), Gwalior | 57.45 | 58 | 34.03 | 69 |
| Koneru Lakshmaiah Education Foundation | 57.37 | 59 | 32.66 | 75 |
| Jaypee Institute Of Information Technology | 56.79 | 60 | 42.55 | 47 |
| Bharati Vidyapeeth Deemed University College Of Engineering-Pune | 56.56 | 61 | 24.58 | 96 |
| Bannari Amman Institute Of Technology-Sathyamangalam | 56.21 | 62 | 33.27 | 71 |
| National Institute Of Technology, Raipur | 55.93 | 63 | 38.11 | 60 |
| Vishwakarma Institute Of Technology-Pune | 55.7 | 64 | 36.41 | 63 |
| National Institute Of Technology, Silchar | 55.49 | 65 | 44.91 | 39 |
| Noorul Islam Centre For Higher Education | 55.45 | 66 | 28.56 | 89 |
| National Institute Of Technology, Srinagar | 55.3 | 67 | 40.77 | 52 |
| University Institute Of Chemical Technology, North Maharashtra University, Jalgaon | 54.91 | 68 | 38.88 | 57 |
| National Institute Of Science & Technology, Berhampur | 54.81 | 69 | 30.51 | 82 |
| Siddaganga Institute Of Technology, Tumkur | 54.67 | 70 | 35.35 | 66 |
| Chaitanya Bharathi Institute Of Technology, Hyderabad | 54.66 | 71 | 31.59 | 79 |
| Hindustan Institute Of Technology And Science (Hits) | 54.32 | 72 | 38.48 | 58 |
| Sagi Ramakrishnam Raju Engineering College, Bhimavaram | 54.02 | 73 | 22.46 | 98 |
| C.V.Raman College Of Engineering, Bhubaneswar | 53.91 | 74 | 26.48 | 94 |
| Kasegaon Education Societys Rajarambapu Institute Of Technology, Islampur | 53.69 | 75 | 29.64 | 84 |
| National Institute Of Technology, Goa | 53.65 | 76 | 31.66 | 78 |
| Pandit Dwarka Prasad Mishra Indian Institute Of Information Technology, Design And Manufacturing (IIITDM), Jabalpur | 53.37 | 77 | 37.20 | 62 |
| National Institute Of Technology, Jamshedpur | 53.35 | 78 | 42.86 | 46 |
| Institute Of Engineering & Management, Kolkata | 53.26 | 79 | 23.10 | 97 |
| Indian Institute Of Information Technology, Design & Manufacturing (Iiitd&M) Kancheepuram-Chennai | 52.64 | 80 | 32.71 | 74 |
| Centurion Institute Of Technology | 52.58 | 81 | 33.00 | 72 |
| College Of Technology And Engineering-Udaipur | 52.39 | 82 | 21.06 | 99 |
| Indian Institute Of Engineering Science & Technology, Shibpur | 52.35 | 83 | 43.31 | 44 |
| Veermata Jijabai Technological Institute | 52.17 | 84 | 35.59 | 65 |
| K. K. Wagh Institute Of Engineering Education & Research-Nashik | 51.92 | 85 | 27.79 | 92 |
| Shri Ramdeobaba College Of Engineering & Management, Nagpur | 51.5 | 86 | 29.17 | 86 |
| National Institute Of Technology, Patna | 51.08 | 87 | 40.90 | 51 |
| Vignan’s Foundation For Science, Technology & Research | 50.65 | 88 | 28.70 | 88 |
| Shri Guru Gobind Singhji Institute Of Engineering & Technology-Nanded | 50.64 | 89 | 41.67 | 48 |
| Sri Ramakrishna Engineering College-Coimbatore | 50.55 | 90 | 27.80 | 91 |
| Bengal Institute Of Technology | 50.33 | 91 | 18.91 | 100 |
| National Institute Of Technology, Delhi | 50.22 | 92 | 29.24 | 85 |
| Yeshwantrao Chavan College Of Engineering, Nagpur | 50.14 | 93 | 26.41 | 95 |
| Adhiyamaan College Of Engineering (Engineering & Technology) | 50.04 | 94 | 28.71 | 87 |
| Maharashtra Academy Of Engineering & Educational Research, Mit College Of Engineering, Pune-Pune | 49.66 | 95 | 39.30 | 56 |
| The National Institute Of Engineering | 49.51 | 96 | 32.33 | 77 |
| Government College Of Engineering, Aurangabad | 49.51 | 97 | 27.82 | 90 |
| Anand Institute Of Higher Technology | 49.41 | 98 | 27.16 | 93 |
| Noida Institute Of Engineering & Technology | 49.24 | 99 | 29.69 | 83 |
| University Institute Of Chemical Engineering & Technology | 49.09 | 100 | 60.74 | 6 |

NIRF Ready Reckoner
- 1,50,000 Votes were cast by 60,000 odd individuals for ascertaining the perception about Institutions across.
- 500 Institutions were involved for getting the Peer Perception ratings.
- 1438 Engineering Institutions participated in India Rankings 2016 based on NIRF.
- 314 of them qualified themselves in Category A Institutions which have a Research Focus along with Teaching.
- 1116 classified themselves into Category B Institutions limited to Teaching only
- The final ranking was however released as one across the categories.
- The Southern part of the country made the highest number of nominations at 737.
WHICH ALL GENRES QUALIFIED FOR TOP
RANKING ENGINEERING
INSTITUTIONS
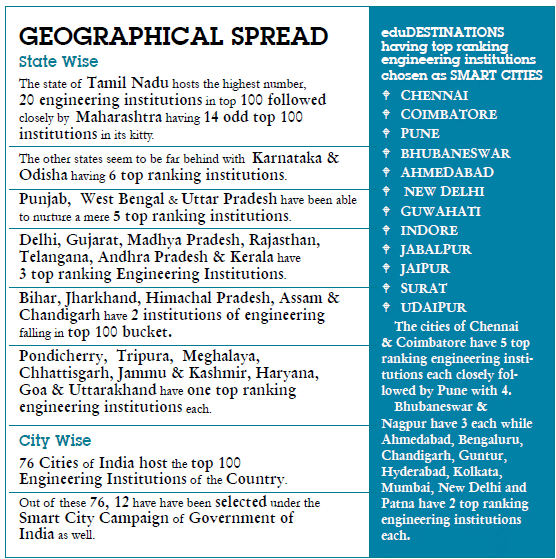
| In the top 100 list of Engineering Institutions, 42 of them fall into the Centrally Funded Technical Institutions (CFTI) category which can be considered to be in the league of Category A institutions. |
| 17 of these top seated institutions fall into the genre of Deemed to Universities. |
| A mere 4 Private Universities have been able to make it to the list of top 100 Engineering Institutions. |
| 15 of these top ranking institutions are affiliated to various State Universities. |
| 2 of these institutions are affiliated to the Central Universities. |
| 20 odd top ranking engineering institutions are affiliated to the State Technical Universities. |
| Anna University has the highest number of 10 affiliated institutions in the top 100 list. |
| Visvesvaraya Technological University Belgaum has got 4 institutions. |
| Biju Patnaik University of Technology Rourkela, the State Technical University of the state of Odisha has 3 institutions. |
| West Bengal University of Technology has got 2 institutions and Dr. A.P.J. Abdul Kalam Technical University has got 1 institutionin the top 100 rank. |


