

The National Institutional Ranking Framework (NIRF) for Indian institutions was approved by the Ministry of Human Resource Development (MHRD) and launched by Honourable Minister of HRD on 29th September 2015.Since 2015, it has become one of the most sought after ranking in India, and every institution wants to see being ranked in the top 100 institutions. First NIRF ranking, based on this framework, were released on 4th April 2016.For India Rankings – 2017, the main ranking parameters remained the same. However, changes in few sub-parameters were made. In 2017, every large institution was given a common overall rank as well as a discipline specific rank, as applicable. Since 2017 there has been no change in the ranking methodology and for 2019 ranking as well, same methodology, as adopted in 2017 was used.
The current paper is an attempt to study the scores of top 100 universities and understand the factors which affect the rankings. Details of the ranking methodology are in the Ranking Document and the details of the ranking parameter calculation are available at the NIRF website.

Data collection
Primary data for all the above parameters and sub-parameters were provided by the respective institutions in the prescribed format. For some criteria such as publication, the primary data was captured from third party sources. Peer perception data was calculated through a survey conducted over a large category of employers, professionals from reputed organizations and a large category of academics to ascertain their preference for graduates of different institutions.
Data for the present study was taken from the published data and the data for the individual institution was captured form the image file published for all the participating and ranked institutions.
Data Analysis
Spatial distribution of the top 100 Universities
The spatial distribution of the top 100 ranked public and private universities is shown in Figure-1. Most of the top ranked universities are in southern states (including Maharashtra) and in and around National Capital Region (NCR). There are only public universities, except 9 private universities, spread over the entire northern, western and eastern states, including NE states of India.
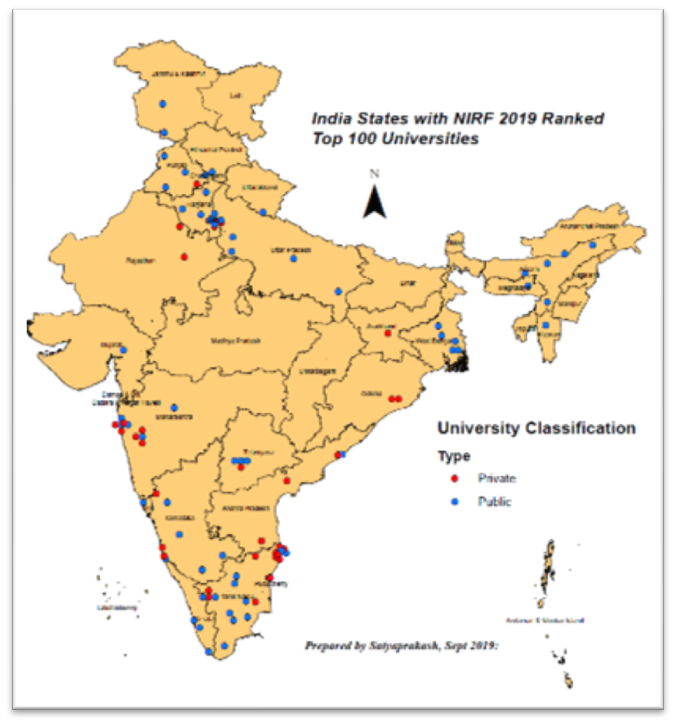
The central states of the country viz., Madhya Pradesh, Chhattisgarh and Bihar does not have any top ranked Universities, either public or private. If 2 private universities of Rajasthan and Orissa,1 public university of Gujarat and1 private university of Jharkhand are excluded, entire heartland of India, does not have any institutions in the top 100. Does it mean that the universities of the central region, whether public or private, do not conform to the standards set by the ranking framework because they do not attract enough students/ faculty. This also means that universities which are strategically located near cities having greater opportunities, southern states and the NCR, attracts both the faculty as well as the students. The authorities and the policy makers need to focus on these regions so that many of the existing universities find place in the top 100, in the coming years.
Student Strength (SS) in the University, including PhD students
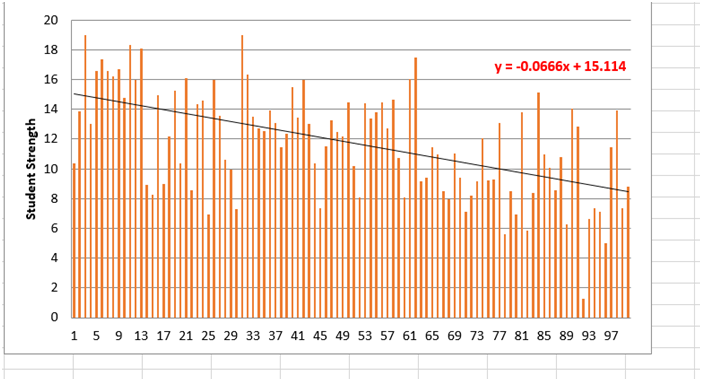
As can be seen from the Figure-2, there is almost 50% decrease in the value for all the universities. A comparison of private and public universities shows almost the same trend (Figure-3) but the drop is steeper in the case of private universities.

Faculty Strength Ratio (FSR) and Qualification
Almost all top 100 universities have maintained the FSR of 1:15, as many of the universities have score of 30 (max) and is true for both private as well as public universities (Figure-4).

The trend continues for the faculty qualification (FQE), budget utilisation (FRU) and University Exam Metric.
The analysis of these parameters shows that except SS, all other factors are almost same for all the universities in the top 100. However, the major factors which affects the ranking are number of PhD students graduating, number of publications, publication quality and patents, discussed below.
Metric for PhD students Graduating
The trend line for metric of PhD student graduating (Figure-5) decreases by 75% from 23 to about 6 and this seems to be one of the factors, affecting the rank.
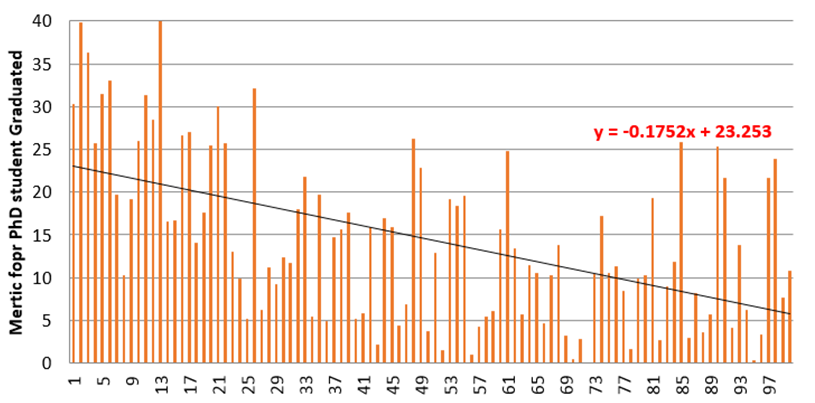
This may be because, more the number of PhD students, more and quality papers are published. The trend continues for public as well as private universities (Figure-6).
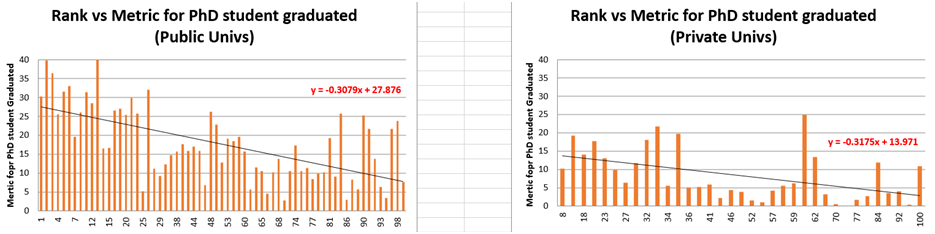
The maximum score for public universities is 40 whereas the same for private is 25, a reduction of ~38% and the trend line starts at ~14 and reaches ~3, a reduction of 80%. There are 11 private universities out of 35, where the score is 10% of the total or less. This percentage for the public universities is very less (only 4 out of 65). The average number of PhD students graduating from all the universities is 14.4, out of a maximum of 40 and that for public and private universities is 17.7 and 8.25 respectively, a decrease of more than 50% for private universities, from public universities.
Publications
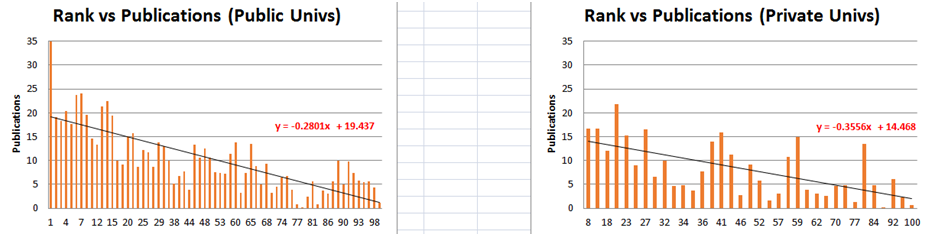
The publication metric (Figure-7) decreases from a maximum of 35 to almost zero in some cases for all the ranked university and the trend line decreases from ~18 to ~1. The trend line starts at relatively higher value for public universities,19.4 vs 14.5 for private, but decreases considerably for the private universities (Figure-8). The average score of public university is 10.2 (decreases by 1 point if IISc is removed from calculation), whereas for private university is 8, a decrease of 22%.
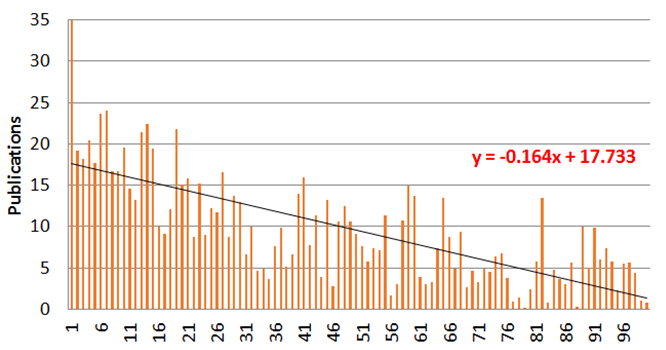
The average score for top 10 public and private universities is 20.54 vs 12.9, a decrease of 37%. For most of the universities in bottom 10, the publication metric for public university is between 5-10 whereas for private universities, it is below 5.
Quality of Publications
The trend line metric for quality of publication (Figure-9) for all the Universities see a massive drop from 19 to around 2. There is also a significant drop (15 from 19) in the y-intercept of the trend line for private universities when compared with the public universities (Figure-10), although the lowest value, seems to be almost same at around 2.

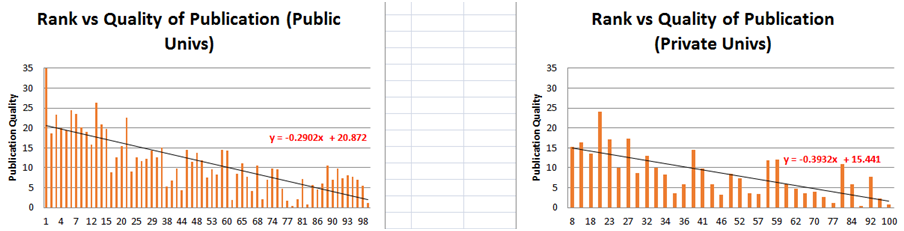
The average for all the university is only 10, out of 35, which increases to 11.3 for public and 8.3 for private universities, a decrease of 25%. The average for top 10 public universities is 21.9 vs 14.5 for private (a decrease of 34%) which decreases to 7.0 for bottom 10 public vs 3.9 for private universities (a decrease of 45%).
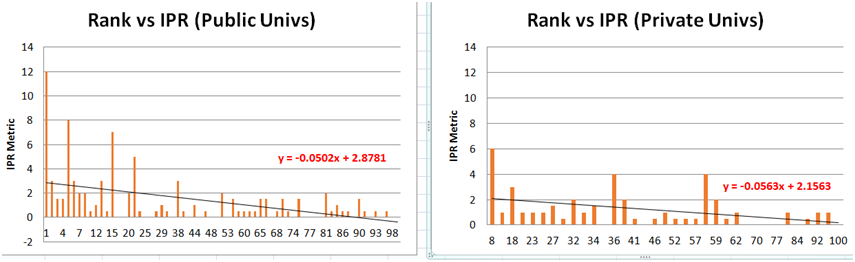
Intellectual Property Rights (IPR)
IPR metric measures the patents filed, published, awarded & licensed. The data for this metric(Figure-11)follows the earlier trend.
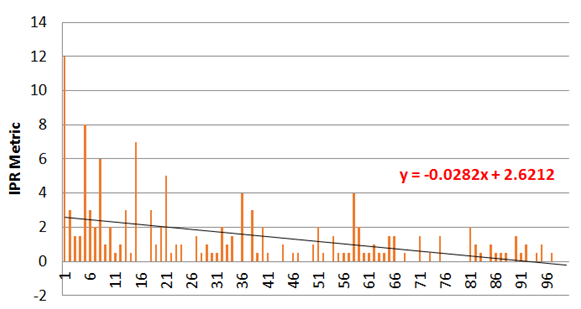
The y-intercept for all universities taken together is 2.6 which reaches to almost negative, as there are several of the universities where this value is “zero” (the number is 29!). For public universities, the number is 21 out of 65 and for private this is 8 out of 35. This means that barring few universities, not much innovation is happening in the top 100 universities as 70% of the universities have the IPR metric 1 or less, out of 15. This number is 68% for the public universities and 74% for the private universities. Interestingly, private universities have a better score here as only 22% of the universities score “zero” whereas public universities with score of zero is 32% (Figure-12). The average for all the universities is 1.2 (8% of the total value) which is 1.22 and 1.14 for public and private universities.
Footprint of Projects, Professional Practice and Executive Development Programs
This metric measures the amount of research funding received by the university in the last 3 years and the amount generated through consultancies and by the virtue of conducting one-year full time faculty development programme (FDP). The trend (Figure-13)
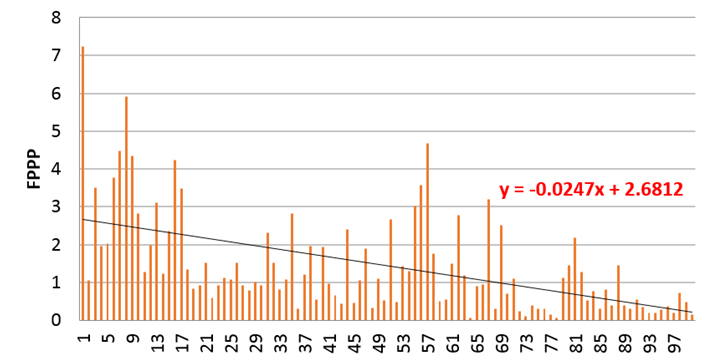
follows the previous graphs that the number and value of sponsored projects and consultancies decreases with the rankings. Comparison of the public and private universities (Figure-14) also shows the same trend. However, the average value tells a different story. The average for public university is 1.41 whereas for the private universities is 1.49.
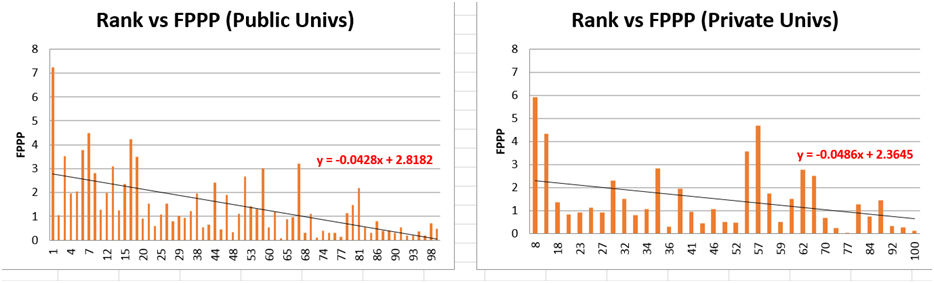
If a comparison is made between the private universities and public universities, except IISc, the private universities are performing slightly better, 1.31 vs 1.49, which is contrasting to the general belief that the research funding is not being provided to the private universities and are not able to generate consultancies. The only contrasting finding is the number of PhD students graduating, which shows that it is less for the private universities. Is there no relationship between number and value of research projects vis-à-vis number of PhD students graduating? It might be due to the fact that the project and consultancy data is for the last 3 years, and on an average a PhD student takes 3-4 years to complete the degree. It would be interesting to see, if the trend changes after few years!
Perception
This metric for the universities was calculated based upon the perceptions of employers and research investors, academic peers, public perception and competitiveness. In India, most of the private universities are looked down, by both employers and research funding agencies. This perception has very well been captured in the perception data (Figure-15).

The average perception index for all the universities is 13.24 with a maximum value of 100, for IISc, and lowest as 0, for 3 private universities. Since IISc has a perception of 100 and the next best is 62.72, the average of all the universities decreases to 12.36. The average for all the public universities is 14.96 which decreases to 10.05 for private universities, a decrease of 33%. The maximum value for private universities, except is 35.3 vs 62.72 for public universities, except IISc, a decrease of almost 44%. For the bottom 10 public university, the average is 4.23 vs 4.36 for private universities, a marginal increase. However, the maximum value of perception for the bottom 10 public university is a mere 8.25 vs 15.99 for private universities, an increase of almost 50%, which is surprising for the private universities. However, the lowest for bottom 10 public university is 0.41 vs 0 for the private universities.
Student diversity
Data was also captured for student diversity, which measures the enrolment of students from other states/ countries, number of women students, socially and physically challenged students. Upon analysing it was found that there in not much variation in the data under this category and in almost all the universities, there is quite a diverse mix of students, including women and physically challenged students. Almost all the university have the facilities for physically challenged students (score is around 18-20 out of 20). However, IISc and University of Hyderabad, which are otherwise ranked as 1 and 4 respectively in overall university ranking, have scored poorly. The score for these two universities is 12 and 11 respectively whereas the national average is 18! These two universities need to improve their facilities for physically challenged students. In terms of percentage of women students, almost all the universities have scored between 26-30 out of 30. Surprising is the case of the top ranked IISc, where this score is only 10, which is well below the national average of 26! Is it due to the fact that less women student take-up Engg/ Science as a career choice? This might be another area of study!
Discussion
Upon analysing the different parameters for 2019 top 100 NIRF ranked universities, it can be concluded that the government of India and the government of states in the central and eastern part of India, need to focus on improving the infrastructure. None of the central states such as Madhya Pradesh, Chhattisgarh, Rajasthan, Bihar, Jharkhand, Gujarat, Orissa, and most of the NE states has any/ or only few top 100 ranked universities, public or private.
Student strength takes a dip with the ranking whereas, the faculty student ratio and faculty qualifications have been maintained at the required level. The university exam metric, which measures the average number of students completing the programme in the stipulated time, is almost flat for all the universities meaning all of them are adhering to the regulations and most of the students are completing the programme, well within time.
Overall the number of PhD students graduating decreases with the rank, but the situation in the private university is very grim. The average score for all the universities, out of maximum 40, is 14.4 whereas it is 17.7 for public universities and 8.2 for private universities, a decrease of more than 50%. For the top 10 public universities, the average score is 30.24 whereas for the private universities this is 14.24, again a decrease of more than 50%. This average goes down to 13.7 for the bottom 10 public universities, almost same as top 10 private universities, and for bottom 10 private universities the score is a mere 3.8 out of 40. This might be due to the fact that students are not preferring the private universities as their choice for enrolling into PhD, may be due to lack of research funding and research facilities. Most of the public universities have provision for research funding through internal sources (seed funding), which ultimately gets converted into external research grants. These grants have the provision of hiring research scholars with stipend, ultimately leading to their PhD degree. Such facility is mostly missing in the private universities, leading to less enrolment and graduation of the PhD students. This has a cascading effect.
The smaller number of PhD scholars and meagre research grant means less research leading to less publications, as is evident from the publication data. All the data of Research and Professional practices are tabulated in Table-1. The publication metric, maximum 35, decreases with rank for both for public as well as private universities. However, the overall publication metric for all the universities is 9.45 which increases to 21.1 for top 10 and reduces to 4.8 for bottom 10 universities. For public universities, this metric is 10.2, 20.5 and 6 respectively, whereas for private universities, this further reduces to 8.07, 12.93 and 4.08. There is a reduction of 40% for top 10 private universities, when compared with top 10 public universities.
Table-1: Consolidate data for Research and Professional Practice metric
| Publication (35) | Quality of Publication (35) | Patents (15) | Projects and Consultancies (15) |
Avg of All Univs |
Avg of top 10 |
Avg of bottom 10 |
Avg of All Univs |
Avg of top 10 |
Avg of bottom 10 |
Avg of All Univs |
Avg of top 10 |
Avg of bottom 10 |
Avg of All Univs |
Avg of top 10 |
Avg of bottom 10 |
|---|---|---|---|---|---|---|---|---|---|---|---|---|
| All Univ (100) |
9.45 | 21.1 | 4.8 | 10.27 | 21.58 | 5.72 | 1.19 | 4 | 0.35 | 1.43 | 3.7 | 0.34 |
| Public Univ in top 100 (65) |
10.2 | 20.54 | 6.02 | 11.29 | 21.92 | 7.00 | 1.22 | 3.45 | 0.35 | 1.41 | 3.01 | 0.38 |
| Private Univs in top 100 (35) |
8.07 | 12.93 | 4.08 | 8.36 | 14.51 | 3.93 | 1.14 | 1.8 | 0.35 | 1.49 | 2.00 | 0.77 |
Quality of publications also shows the same trend. Overall there is a decrease of 26% between public and private universities, whereas this increases to 34% in the case of top 10 and 43% for bottom 10 universities. This was expected as the students do not prefer private institutions as the favourite destination for pursing PhD. IPR and FPPP, the metric for measure of innovations and consultancies are nothing to talk about. The score for all the universities combined, is a pathetic 7%, with a maximum of only 27% of the total. If the score of IISc is removed from the calculation, the average of all the universities reduces to 1.08 from 1.19 and for public universities to 1.05 from 1.22, which is even less than all the private universities combined! For the top 10 public universities, this value reduces to 2.5from 4 (a reduction of almost 37%) and is a mere 17% of the maximum value. The government and the administration need to step in here and see how this can be improved. This might be one of the reasons, why India is lagging in innovation at the global level.
Conclusion
The analysis shows that the enrolment of students increases with improved ranking or may be that that a better ranking brings more and better students to the university. All the universities, be it public or private have faculty as per the student intake and the faculty qualifications matches the requirement of the governing agencies. The student faculty ratio is being maintained under 1:20 for almost all the universities. The students also graduate in the minimum stipulated time. The spatial distribution of these top 100 universities shows that the central India and NE India lack good infrastructure and facilities and good students are not opting for universities of these regions which is ultimately affecting their rankings. Government may need to intervene and start quite a few universities with good facilities which may attract students. There have been some efforts of opening at least one central university in every state, but the results might take some time, as only one central university has figured in the top 100 universities, only two in the band 101-150 and 4 in 151-200 band. This also might be because there are very less industries which calls for less employment and hence students prefer to move to those regions which have industries and opportunities. This might be one of the reasons to why the top 100 universities are concentrated in the southern and western states and in National Capital Region of Delhi. Lack of PhD enrolment, as is evident from less PhD students graduating, from lower ranked universities also has a direct effect on the number and quality of publications. Patents and consultancies are nothing to write home about, as the scores are dismal low for all the top 100 Indian universities. The government need to intervene, and students need to inculcate the eco-system of innovations and entrepreneurship from school/ college level so that this score improves. There needs to be a major mind-set change of the students so as more and more innovations are done at the school/ college level. Perception was another parameter which was studied, and the data proves that the better perception comes from better placements, opportunities and research facilities which the university has. Student diversity was seen in almost all the universities across the country and most of the universities have very good facilities for socially and physically challenged students. However, IISc and University of Hyderabad need to improve their facilities for socially and physically challenged students and IISc also needs to re-think its strategy to attract more women students in their programs.
Will the pattern repeat this year as well, this needs to be seen with the NIRF 2020 results, which shall be published sometime in June 2020. Till then…
(Disclaimer: The writer is Satyaprakash, Professor, Deparement of Civil Engineering, Sharda University Views expressed are a personal opinion.)